
Total Impact
1. Campaign Share of Impact
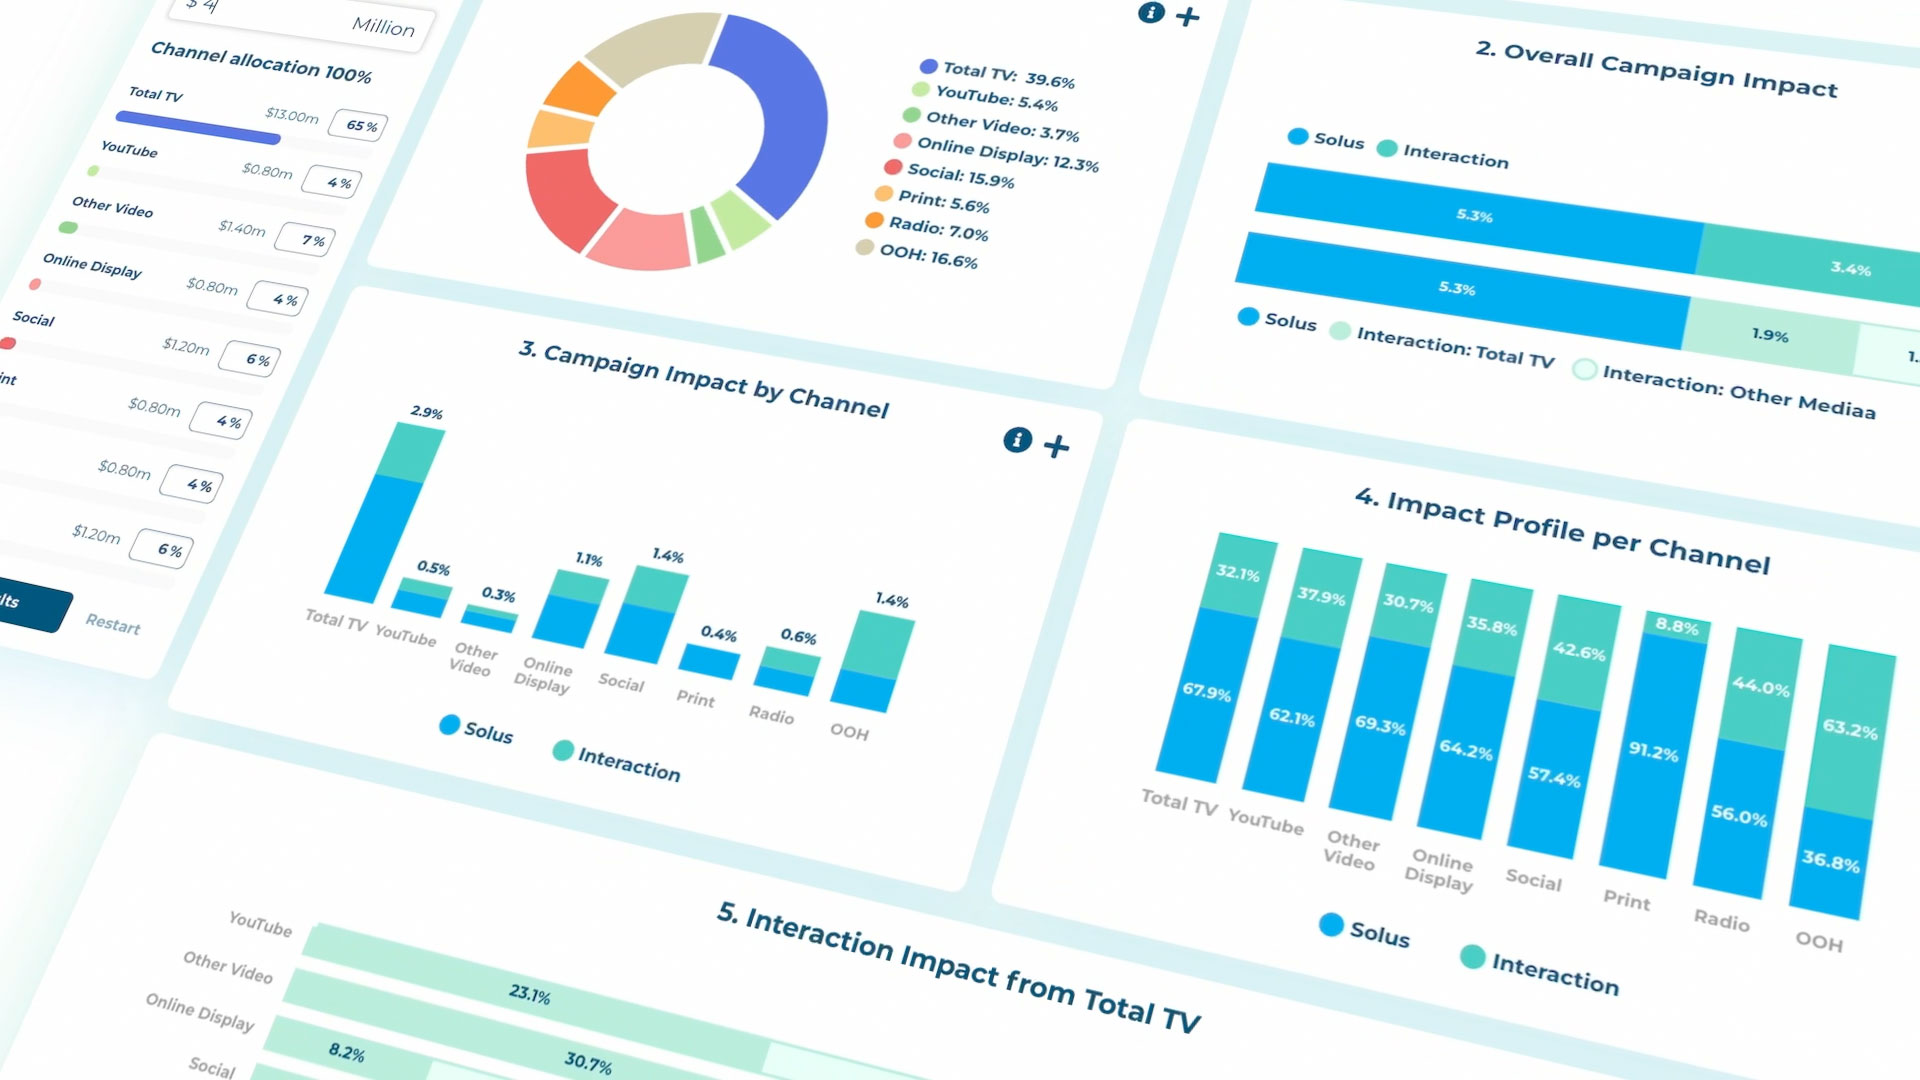
About this chart: The pie chart shows the brand impact generated by each channel. This impact is calculated using the inputs from the communication objective and % of spend. To increase brand impact, consider increasing the % spend for the channels with highest share of impact and decreasing spend for those with lowest share.
2. Overall Campaign Impact
About this chart: The impact each media channel has is a combination of the effect it can generate if it were to run on its own (solus effect) and the multiplier effect is has when it runs in combination with other media (interaction effect). This chart also shows how this impact is split by solus effects (all channels), Total TV interaction effects and Other media interaction effects.
3. Campaign Impact by Channel
About this chart: By splitting out the total campaign impact, it is possible to see how channels deliver brand impact and whether this impact is generated on its own (solus) or through the combination of other media (interaction). This chart shows the % of brand impact delivered by each channel and how this is split across solus and interaction effects. Solus impact tends to do the heavy lifting in terms of overall campaign impact.
4. Impact Profile per Channel
About this chart: If a channel derives the majority of its impact from solus effects, then they are less reliant on integrated campaigns and other media to create brand impact.
5. Interaction Impact from Total TV
About this chart: TV has strong solus effects and will generate the strongest cross-media synergies to drive either top or bottom of funnel brand impact. Consider increasing the % of spend to TV and the top three interactions.
Get started by using the inputs to...

Set communication objective

Enter campaign spend

Set channel allocation

Review & adjust for the best outcome
Additional notes: Kantar metrics evaluate impact in three main areas; Brand Awareness (top of mind, buzz, familiarity), Brand Consideration (intention to buy) and Total Brand Impact (awareness, associations, motivation and consideration). By adding total spend and spend by channel, the Brand Engine estimates brand impact generated by each channel according to your communication objective.
1.
Campaign Share of Impact
2.
Overall Campaign Impact
3.
Campaign Impact by Channel
4.
Impact Profile per Channel
5.
Interaction Impact from Total TV
Campaign Share of Impact
Total Impact
About this chart: The pie chart shows the brand impact generated by each channel. This impact is calculated using the inputs from the communication objective and % of spend. To increase brand impact, consider increasing the % spend for the channels with highest share of impact and decreasing spend for those with lowest share.
Overall Campaign Impact
Total Impact
About this chart: The impact each media channel has is a combination of the effect it can generate if it were to run on its own (solus effect) and the multiplier effect is has when it runs in combination with other media (interaction effect). This chart also shows how this impact is split by solus effects (all channels), Total TV interaction effects and Other media interaction effects.
Campaign Impact by Channel
Total Impact
About this chart: By splitting out the total campaign impact, it is possible to see how channels deliver brand impact and whether this impact is generated on its own (solus) or through the combination of other media (interaction). This chart shows the % of brand impact delivered by each channel and how this is split across solus and interaction effects. Solus impact tends to do the heavy lifting in terms of overall campaign impact.
Impact Profile per Channel
Total Impact
About this chart: If a channel derives the majority of its impact from solus effects, then they are less reliant on integrated campaigns and other media to create brand impact.
Interaction Impact from Total TV
About this chart: TV has strong solus effects and will generate the strongest cross-media synergies to drive either top or bottom of funnel brand impact. Consider increasing the % of spend to TV and the top three interactions.
Source: Kantar CrossMedia Database 179 campaigns, Total TV includes BVOD and Linear, other video includes programmatic video and video on other online websites.