About AdNation
ThinkTV’s AdNation Study surveyed more than 1,600 adland professionals and more than 1,000 ‘normal’ people to identify differences and similarities in the two groups’ lifestyles and their usage of – and attitudes towards – different media.
The results were pretty striking.
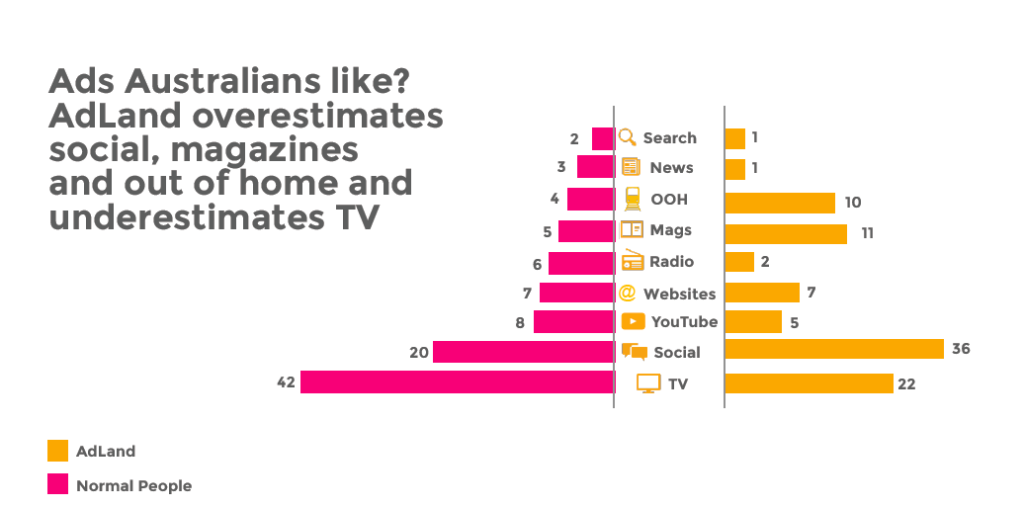
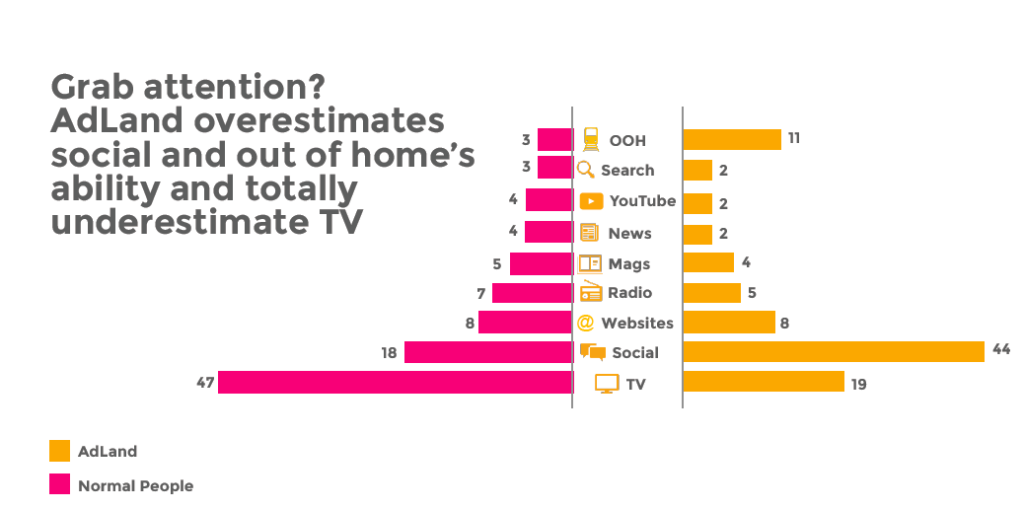
When it came to advertising, normal folks clearly identified TV as the most likely place to find advertising that draws attention to a product, brand or service they had not heard of.
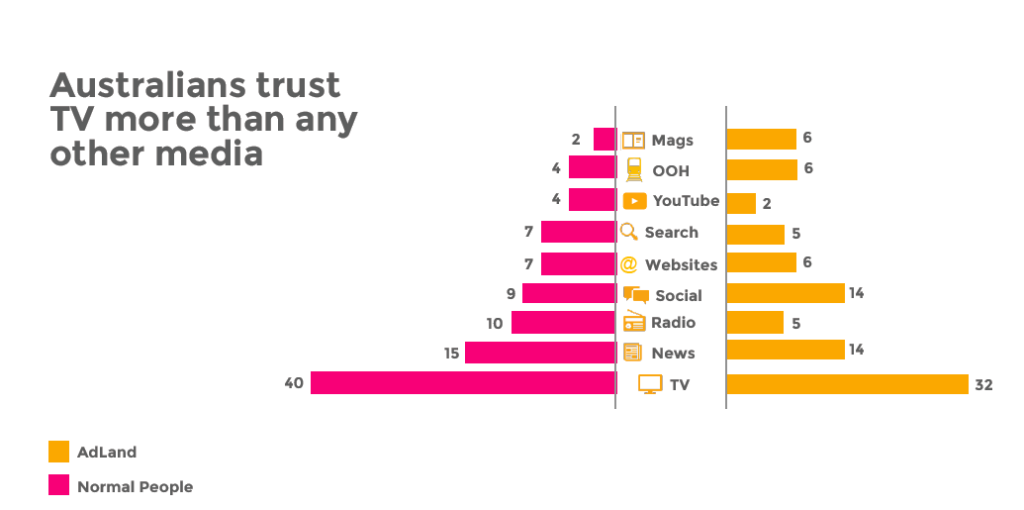
But guess what? Adlanders had an entirely different view nominating social media as the most likely medium to get people’s attention. Yet when asked where they would be most likely to find trusted advertising that would make them feel emotional and stick in the memory, our adlanders agreed with the normals that TV was the winning medium.
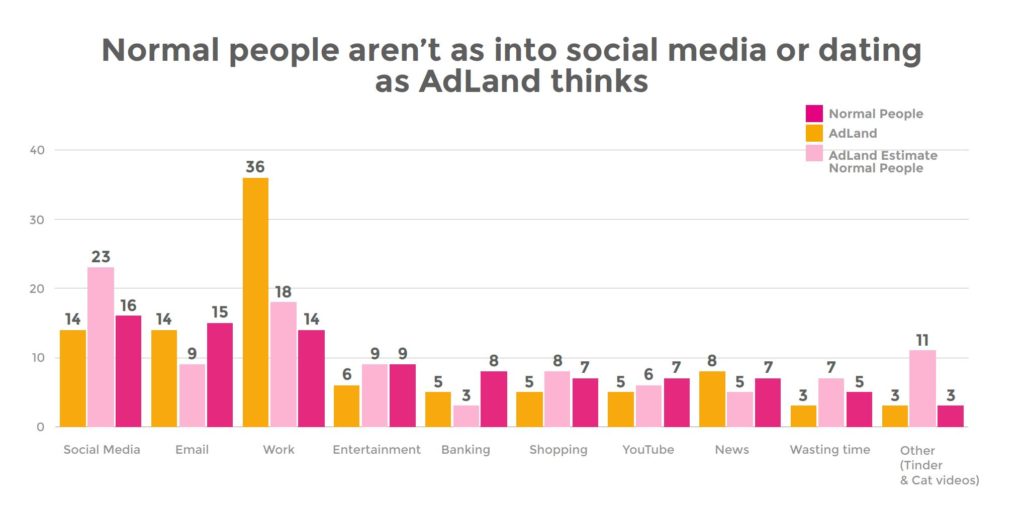
And that wasn’t the only difference between the two groups. Us adlanders have radically different lifestyles and media consumption habits compared to the general public including a much larger online footprint, particularly when it comes to social media.
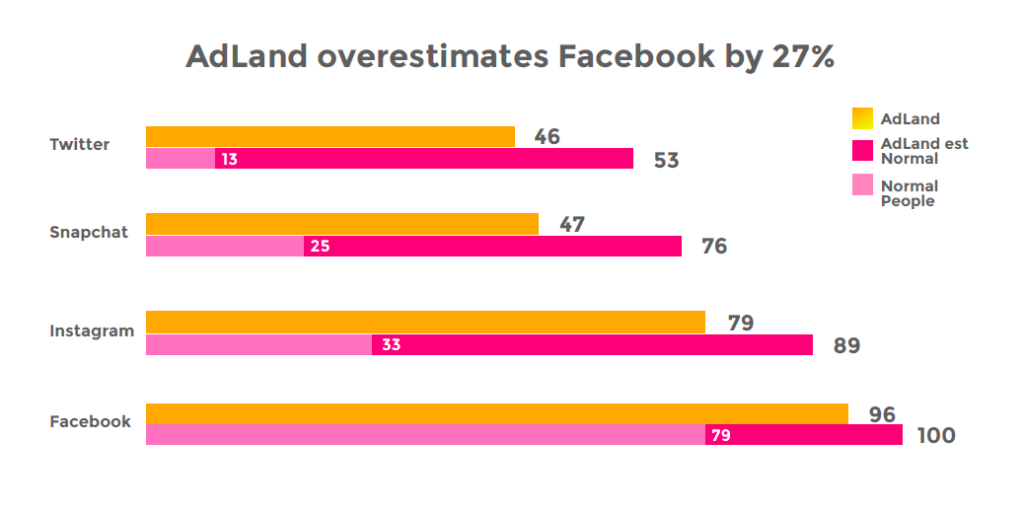
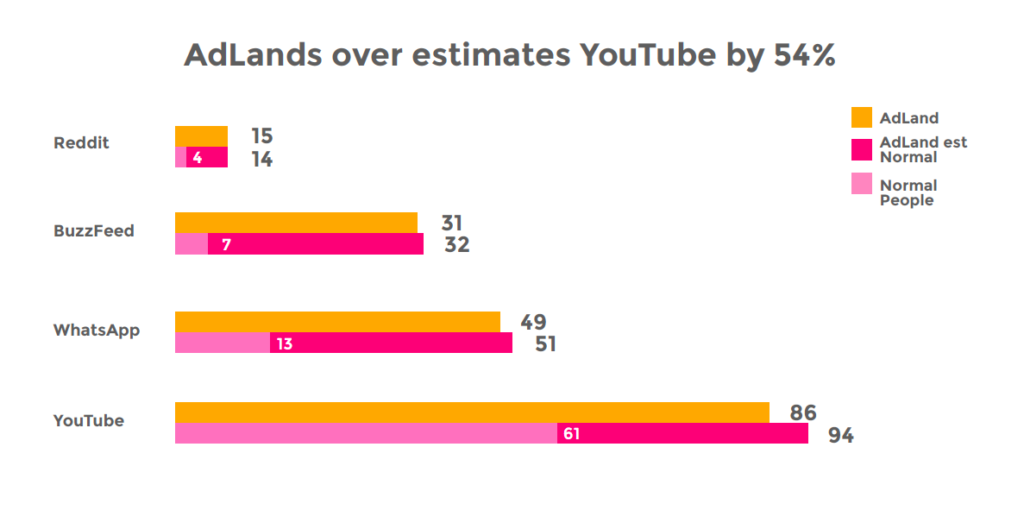
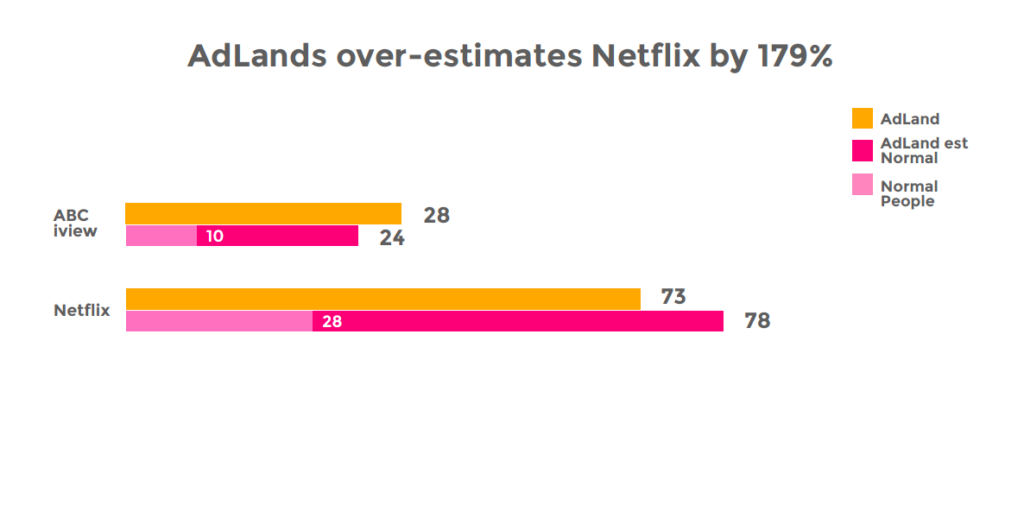
It turns out that many advertising, marketing and media professionals are uninformed about the media consumption habits and attitudes of ‘normal’ Australians as adlanders significantly overestimate people’s use of online platforms.
Here’s what the research discovered:
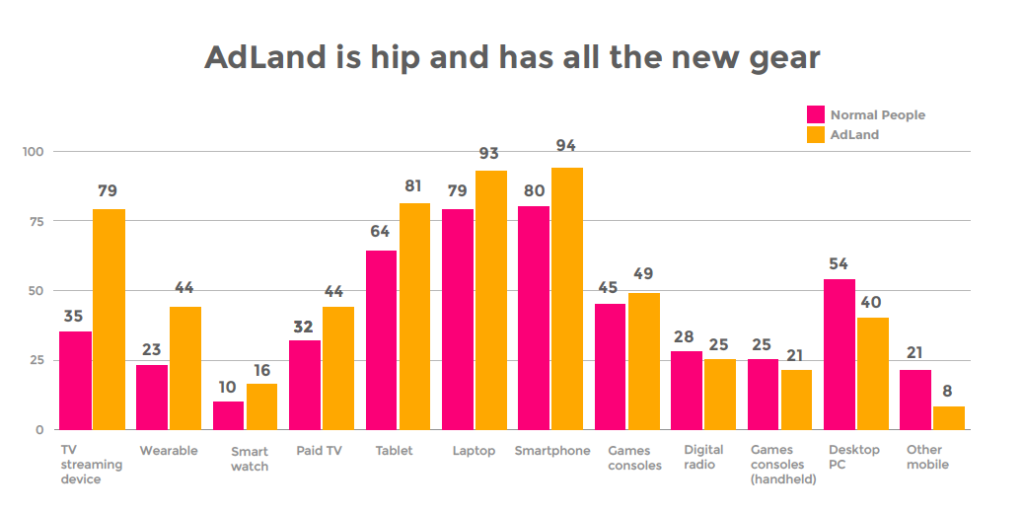
Adlanders also love the latest devices; they are 129% more likely to own a TV streaming device (such as Chromecast or Apple TV), 83% more likely to own wearables and 60% more likely to own a smartwatch.
Adlanders are 18% more likely to own a laptop or a smartphone, 27% more likely to own a tablet or a coffee machine.
On the flip-side, normal people are 38% more likely to have fly screens, and twice as likely to have a lawn mower.
Media usage and perceptions
It turns out us adlanders aren’t great at estimating the average Australians’ use of different types of media.
We asked adlanders which social media they had accessed in the last seven days before having them estimate the same for real Australians.
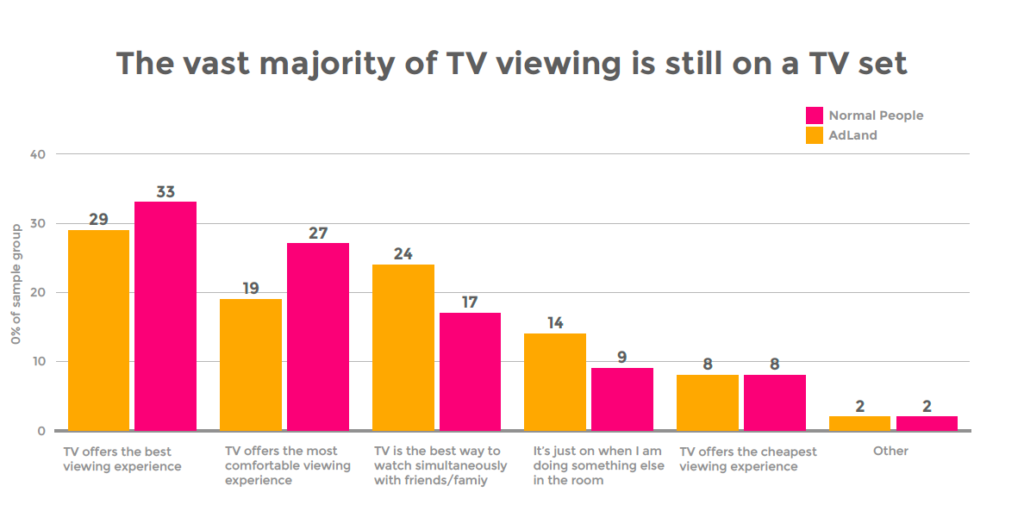
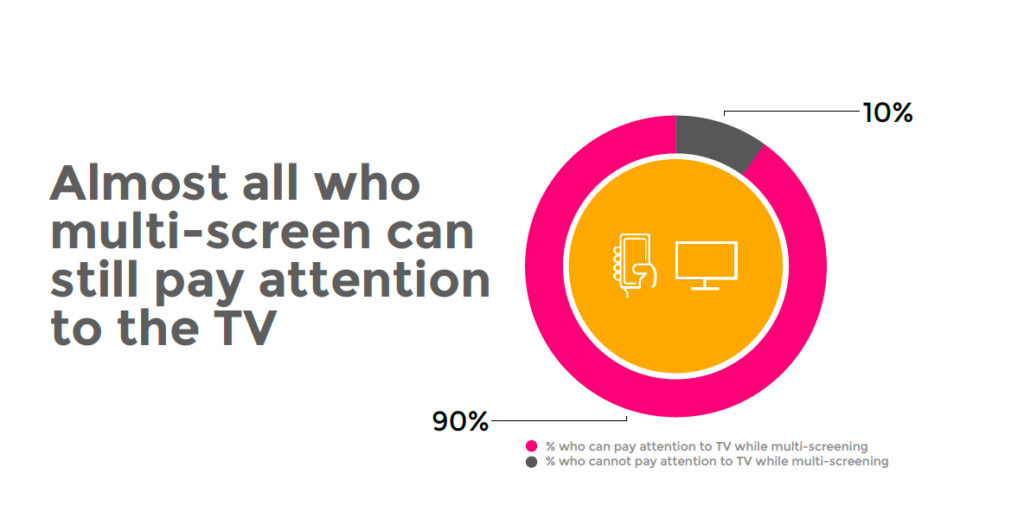
Well, we already know it’s a myth because Nielsen/OzTAM/RegionalTAM figures show 86.6% of viewing of broadcast TV content is watched on in-home sets within 28 days of the original transmission.
AdNation provides some insight into why that’s the case: everyone agreed that the TV set offers the best viewing experience. It’s big. It’s loud, people like their lounge-rooms because they’re comfy and can watch with their family and friends at the same time.
More like this

Facts & Stats
Attention. Emotion. Impact & Profit.
Total TV remains the master of effectiveness in the videoverse, no matter which part of the funnel you’re looking at.

Facts & Stats
Make Total TV first on & last off every media plan
While plenty of channels can reach large numbers of the Australian population, few can do it as quickly and simultaneously as TV. With engaged, attentive viewers, TV continues to do […]

Facts & Stats
Advertising Pays
The economic, employment and business value of advertising
Facts & Stats
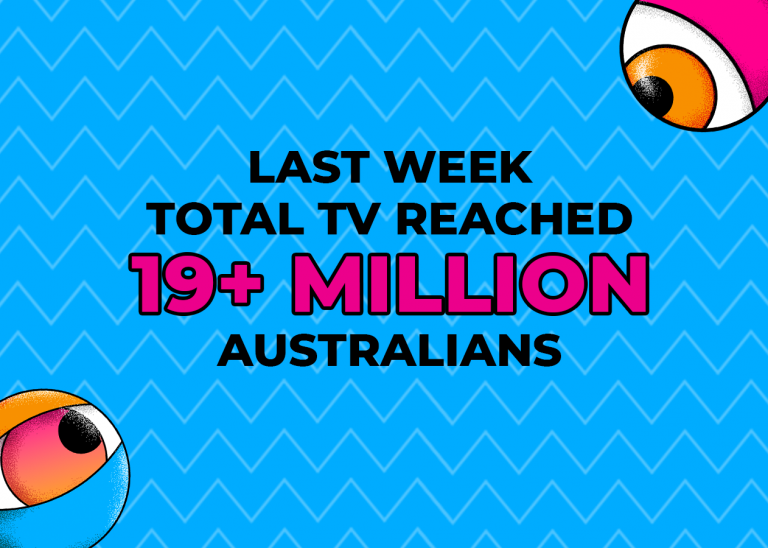
Total TV Reach
A full picture of TV’s growing audience across screens.

Facts & Stats / The Benchmark Series
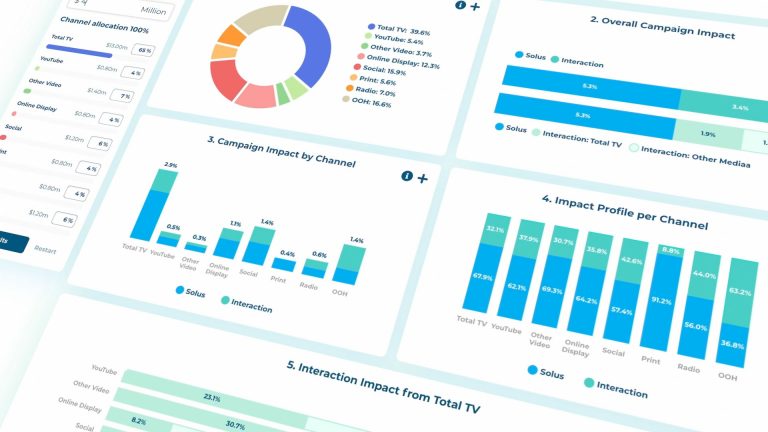
The Benchmark Series: Cross Channel Impact
In its seventh year, The Benchmark Series investigates the impact of different media channels and their interactions to drive the best media mix.
Facts & Stats / The Benchmark Series
The Brand Engine: Optimise your media spend & power better brand outcomes
Marketers are always looking to increase effectiveness and efficiency of media investment, but without consistent access to econometric modelling it can be challenging to design campaigns for the best possible […]

Facts & Stats
BVOD consumption
Australia’s fastest-growing media channel continues to accelerate.
Facts & Stats / The Effie Awards
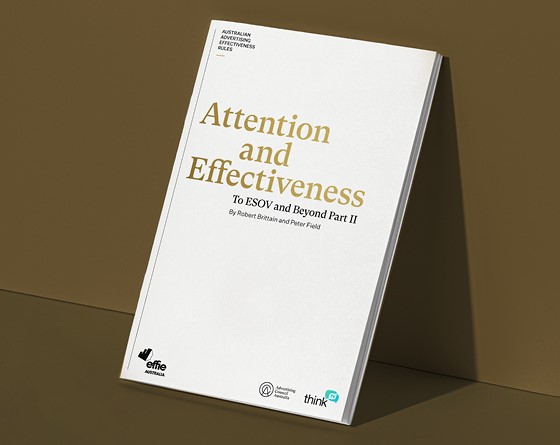
Attention & Effectiveness: To ESOV & Beyond Part II
Find out how you can supercharge attention for your marketing campaigns.

Facts & Stats / The Payback Series
Media Engine: Power up the revenue returns of your next campaign
With a wealth of econometric and campaign learnings at our fingertips, we wanted to find a way to help ensure your briefs are grounded in facts. Because smart strategies, powered […]

Facts & Stats / The Benchmark Series


